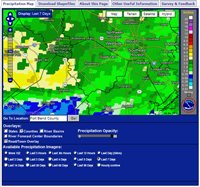
The National Weather Service (NWS) Precipitation Maps graphically show the latest short-term observed precipitation across the majority of the National Weather Service CONUS and Puerto Rico.
Observed Precipitation
"Observed" data is the water equivalent estimation of all types of precipitation (rain, snow, sleet, freezing rain, hail) derived from NWS River Forecast Centers (RFCs) , and is displayed as a gridded field with a spatial resolution of 4x4 km. "Observed" data is expressed as a short-term duration total ending at the hour indicated in UTC (same as Greenwich Mean Time, or GMT). For example 1200 GMT coincides with 8 AM EDT, 7 AM EST, 7 AM CDT, 6 AM CST, etc.
When viewing "NWS" data, you may notice that "Observed" data extends beyond the U.S. border into Mexico. The West Gulf RFC has service areas that extend beyond the U.S. border, in order to model rivers that flow into the United States, (i.e. tributaries of the Rio Grande along the Texas-Mexico border.) Although no forecasts are provided outside of U.S. boundaries, precipitation estimates are created over these areas in order to simulate stream flow along these rivers as they cross into the United States. When viewing the data, it may be helpful to turn on the "RFC Boundary" overlay as a geographic reference.
|
|
||
 |
 |