Performance metrics by month and year
| december 2019 Statistics | |
|---|---|
| Dispatched Calls | 2,707 |
| Transportation Rate | 73 % |
| Transport Miles | 14,135 |
| Aeromedical Patients | 4 |
| Response times: 50th Percentile | 6 min 16 sec |
| Response times: 90th Percentile | 10 min 47 sec |
| Posting (District cover assignments) | 474 |
| System Status Management | 13 (episodes of less than 5 available MICUs in the county) |
| 2019 Year to date | |
|---|---|
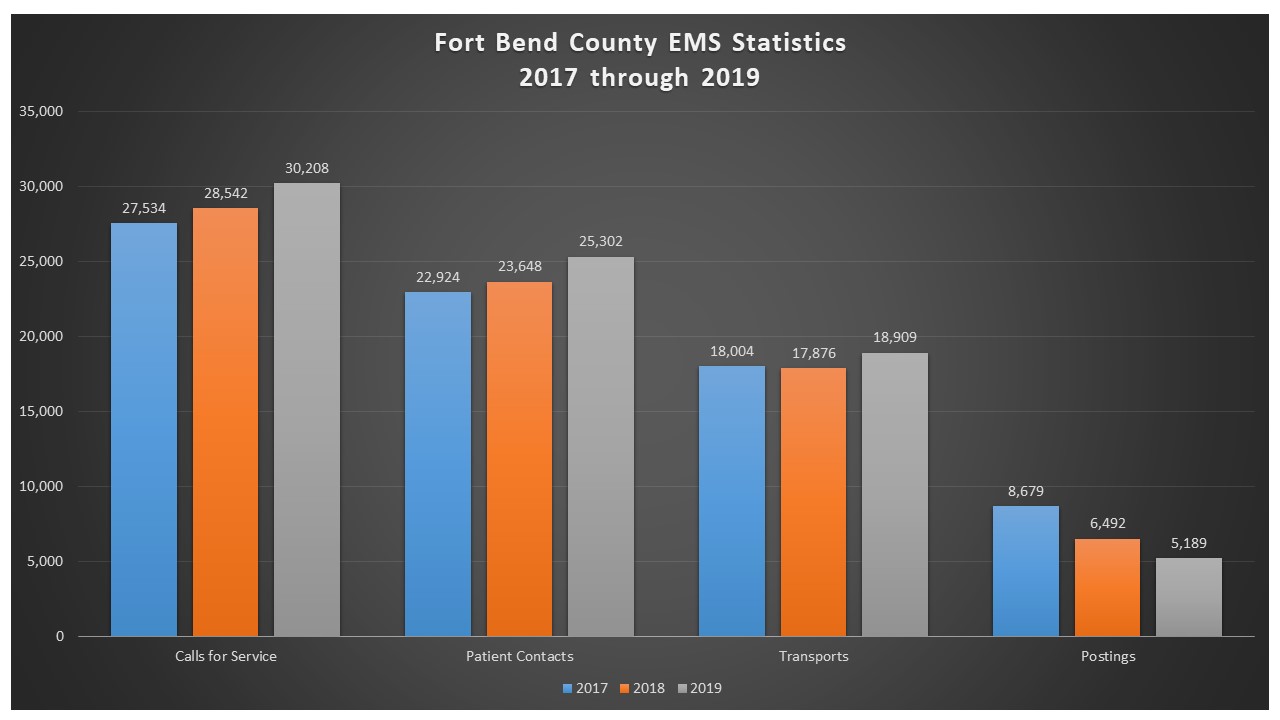
| Dispatched Calls | 30,208 Comparisons |
| Transportation Rate (avg) | 74% |
| Transport Miles |
158,400 Comparisons |
| Aeromedical Patients | 60 |
| Response times: 50th Percentile (avg) | 6:04 |
| Response times: 90th Percentile (avg) |
10:53 |
| Posting (District cover assignments) | 5,189 |
| System Status Management |
120 (episodes of less than 5 available MICUs in the county) |
| december 2019 Top 6 Busiest Medic Units (number of calls) | |
|---|---|
| Medic 610 | 320 |
|
Medic 606 |
266 |
|
Medic 613 |
266 |
| Medic 601 | 250 |
| Medic 607 | 246 |
| Medic 603 | 243 |
| 2019 Year to date Top 6 Busiest Medic Units (number of calls) | |
|---|---|
| Medic 610 | 3,337 |
| Medic 606 | 2,914 |
| Medic 613 | 2,899 |
| Medic 601 | 2,891 |
| Medic 602 | 2,809 |
| Medic 607 | 2,700 |